

Beyond the Financial Statements: Building a Charter School Dashboard That Helps Boards Govern
Balance sheets, profit-and-loss statements, and budget comparisons are essential—but they do not always make a charter school’s financial condition easy for board members to understand. A strong dashboard translates the accounting into governance information.
By Kevin Davis | July 31, 2026 | 8-minute read
Key Takeaways
- Standard financial statements provide essential detail, but boards also need interpretation.
- Cash, liquidity, operating margin, budget variance, enrollment, and trends should be visible at a glance.
- Monthly results should be distinguished from year-to-date performance.
- Significant variances need explanations—not merely numbers.
- A dashboard should identify risks and board considerations without pulling directors into daily management.
- Metrics and targets must reflect the school’s circumstances, obligations, and authorizer expectations.
Financial Reporting Is Not the Same as Financial Governance
Charter school boards commonly receive a balance sheet, profit-and-loss statement, and budget-to-actual report each month. Those reports document the school’s transactions and financial position, but they may leave board members without clear answers to their most important questions:
- Does the school have enough cash?
- Is it operating sustainably?
- Are results improving or deteriorating?
- What is causing the most significant variances?
- Which risks require board attention?
- What should the board monitor next month?
A useful financial dashboard does not replace the traditional statements. It translates them into a concise set of indicators, trends, explanations, and considerations that help the board govern.
Begin With a Small Set of Meaningful Indicators
A board dashboard should not attempt to summarize every account. It should elevate the measures most closely connected to liquidity, sustainability, leverage, and performance.
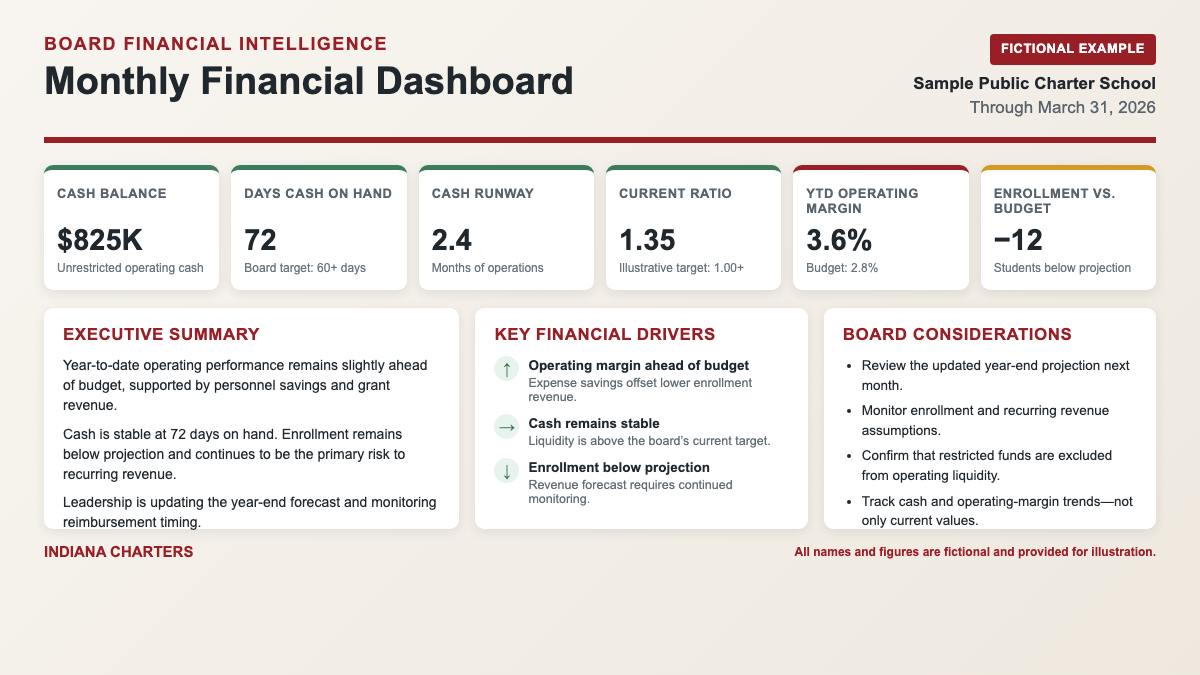
A fictionalized monthly dashboard might include:
- Cash balance: $825,000
- Days cash on hand: 72 days
- Cash runway: 2.4 months
- Current ratio: 1.35
- Year-to-date operating margin: 3.6%
- Budget variance: $38,000 favorable
- Enrollment compared with budget: 12 students below projection
These figures are fictional and provided only to illustrate a reporting approach. They do not represent an actual school.
Targets should not be treated as universal standards. A school should establish thresholds based on its operating model, authorizer requirements, debt agreements, enrollment risk, facilities obligations, and access to reserves.
Cash Requires More Than One Number
Cash is among the most important financial measures for a charter school, but the cash balance alone can be misleading.
Cash Balance
This shows the amount available on a particular date. The dashboard should distinguish unrestricted operating cash from restricted funds when that difference is material.
Days Cash on Hand
Days cash on hand estimates how long the school could continue paying normal operating expenses using available cash. A simplified calculation is:
Unrestricted cash ÷ average daily operating expenses
This creates a more useful comparison across time than the cash balance by itself. A school with $500,000 in cash may appear healthy until the board learns how quickly its normal expenses consume that amount.
Cash Runway
Expressing liquidity in months can make the same concept easier for some board members to understand: if expected revenue stopped temporarily, approximately how many months could the school continue operating?
The trend matters as much as the current value. A gradual decline over several months may be more significant than whether the school remains barely above a target.
Short-Term Cash Forecast
For schools with uneven reimbursements, grant payments, or enrollment-based funding, the dashboard should also include a forward-looking cash forecast. Historical cash shows where the school has been. A forecast helps the board see what may happen next.
Separate Operating Results From the Bottom Line
Boards should understand whether the school’s core operations are financially sustainable.
Operating income generally reflects revenue and expenses associated with the school’s regular activities. It helps the board evaluate whether the ongoing educational and organizational model is sustainable.
Net income includes the final effect of non-operating items and other accounting activity. It remains important, but it may not always describe core operations as clearly.
The dashboard should explain material differences between the two. It should also avoid allowing transfers between funds or one-time transactions to make operating performance appear stronger or weaker than it really is.
Show Monthly and Year-to-Date Performance
A single month can be volatile. Payroll timing, reimbursements, grant revenue, insurance, facilities expenses, and large purchases can distort a monthly result.
For that reason, the dashboard should display both:
- The current month compared with budget and the prior year
- Year-to-date performance compared with budget and the prior year
Monthly reporting may reveal a new development, while year-to-date reporting provides a more stable view of the school’s financial direction. A poor month does not always signal a crisis. A favorable year-to-date result does not always mean emerging problems can be ignored.
Explain the Drivers Behind the Numbers
A variance report tells the board where actual results differ from the budget. A useful dashboard explains why.
The report might identify that:
- State funding increased because enrollment exceeded the original projection.
- A reimbursement was delayed and is expected the following month.
- Payroll exceeded budget because of additional staffing or vacancies filled earlier than planned.
- Professional-service expenses increased because of an unanticipated project.
- Facilities costs remained consistent with the prior year.
- Grant revenue and related expenses occurred later than budgeted.
The board does not need a narrative for every account. It should understand the factors most responsible for the school’s performance.
Add an Executive Summary
The executive summary may be the most valuable part of the report. In a few paragraphs, it should explain:
- The school’s overall financial position
- Its year-to-date operating performance
- Significant changes since the previous report
- The primary causes of material variances
- The issues leadership and the board should continue monitoring
That interpretation gives board members an accessible starting point before they review the supporting statements.
Identify Risks and Board Considerations
A dashboard should not simply celebrate favorable results. It should identify conditions that could affect the school’s future, including:
- Cash falling below the school’s target
- Enrollment below budget
- Continuing operating deficits
- Receivables growing or aging
- Reliance on temporary grants
- Debt or lease obligations
- Staffing costs increasing faster than recurring revenue
- Restricted funds being mistaken for operating resources
- Significant budget assumptions no longer being realistic
This section should not direct the board to manage individual expenses. It should identify the governance questions raised by the results.
Include Trends, Not Just Snapshots
A metric becomes more meaningful when the board can see its direction. Sixty-five days cash on hand may appear acceptable, but if the previous reports showed 92, 81, and 73 days, the declining trend deserves attention.
Simple trend indicators can help directors recognize declining liquidity, improving margins, growing personnel costs, recurring unfavorable variances, enrollment changes, and dependence on irregular revenue. The board should not need to compare several old packets manually to recognize a developing pattern.
Preserve the Supporting Financial Statements
A dashboard should never become a substitute for complete financial reporting. The board should still receive, as appropriate:
- Balance sheet
- Profit-and-loss statement
- Budget-to-actual report
- Cash-flow information
- Accounts payable or receivable detail
- Enrollment and funding information
- Grant or restricted-fund reporting
- Updated forecasts
The dashboard is the entry point. The supporting reports provide the detail necessary to verify and explore what the dashboard communicates.
A Practical Dashboard Structure
- Financial dashboard: A small set of liquidity, sustainability, leverage, and performance indicators.
- Executive summary: A plain-language explanation of the school’s overall financial position.
- Key financial drivers: The most important factors affecting revenue, expenses, and cash.
- Risks and board considerations: Emerging issues that warrant governance attention.
- Supporting statements: Monthly and year-to-date results, budget comparisons, and balance-sheet information.
The result should be a report that an engaged board member can understand without being an accountant—and that an accountant can trace back to the underlying records.
Better Information Supports Better Governance
A charter school board cannot fulfill its fiduciary responsibilities merely by receiving financial statements. It must understand the school’s financial position, recognize developing risks, and ask informed questions about sustainability.
The goal is not to produce a more attractive report. It is to help the board recognize what matters, understand why it matters, and govern accordingly.
Board Financial Intelligence From Indiana Charters
Board Financial Intelligence is included for partner schools whose Indiana Charters service agreements include financial reporting and advisory support. We translate monthly financial statements into concise dashboards, executive summaries, trends, and board-level considerations while each school retains its independent governance and management.
Schools outside the partner network may engage Indiana Charters for a stand-alone dashboard implementation or continuing monthly reporting. We can work with a school’s existing accountant and financial records without taking over its bookkeeping or management functions.
Stand-alone dashboard engagements begin at $4,500. Ongoing monthly Board Financial Intelligence is available through a separately scoped engagement.